Inventory Growth and Market Balance
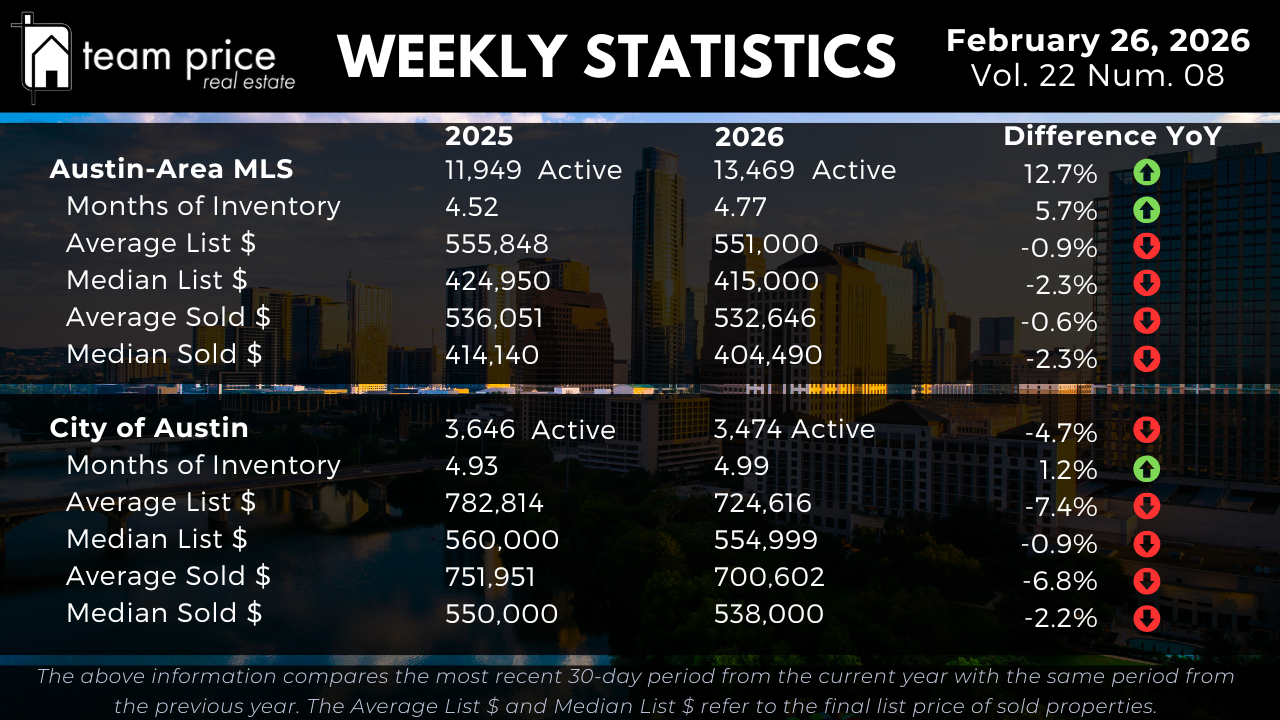
Active residential listings across the Austin-Area MLS now total 13,469, up from 11,949 at the same point last year. That represents a 12.7 percent year over year increase in available supply. Inventory continues to expand as new listings enter the market at a pace that exceeds closed sales. Based on current transaction volume, Months of Inventory stands at 4.77, compared to 4.52 one year ago, a 5.7 percent increase. In practical terms, the market is carrying roughly 1.1 times more supply relative to demand than it was at this time last year. Absorption remains measured, and while week over week fluctuations occur, the broader trend shows a market that is more supplied than it was entering 2025.
Inside the City of Austin, inventory trends are slightly different but still important. Active listings have declined from 3,646 last year to 3,474 today, down 4.7 percent year over year. However, Months of Inventory has edged up from 4.93 to 4.99 months, a 1.2 percent increase. This tells us that while raw listing counts are slightly lower, the pace of sales relative to supply has not accelerated. The city market is not tightening in a way that would suggest strong upward price pressure. Instead, it remains balanced with buyers continuing to hold negotiating leverage.
Pricing Stability Across the MLS
Pricing across the Austin-Area MLS is showing modest year over year declines, but the rate of decline has slowed compared to prior periods. The average active list price has moved from $555,848 last year to $551,000, down 0.9 percent year over year. The median active list price has declined from $424,950 to $415,000, down 2.3 percent. These adjustments indicate that sellers are pricing more competitively, but we are no longer seeing the sharper corrections that defined earlier phases of the reset.
On the sales side, the average sold price has moved from $536,051 to $532,646, down 0.6 percent year over year. The median sold price has declined from $414,140 to $404,490, down 2.3 percent. When both averages and medians move lower together, it confirms broad based price compression rather than isolated weakness in one segment. Week over week pricing remains relatively stable, but year over year comparisons continue to show mild downward pressure.
Pricing Trends in the City of Austin
Within the City of Austin, pricing adjustments are more pronounced than the broader metro in several categories. The average active list price has declined from $782,814 to $724,616, down 7.4 percent year over year. The median active list price has edged lower from $560,000 to $554,999, a 0.9 percent decline. This suggests that higher price points inside the urban core are recalibrating more meaningfully, even as mid tier pricing shows relative stability.
Closed sale data reinforces this trend. The average sold price has fallen from $751,951 to $700,602, down 6.8 percent year over year. The median sold price has declined from $550,000 to $538,000, a 2.2 percent decrease. While these declines are not extreme, they are consistent and measurable. Compared to the broader Austin-Area MLS, the city continues to show somewhat larger adjustments in average pricing, particularly at the upper end.
Negotiation and Buyer Leverage
Negotiation remains a defining characteristic of the Austin housing market. So far this month, 70.43 percent of all closed sales across the Austin-Area MLS have sold below list price, slightly higher than last month’s 70.09 percent. About 18.41 percent have sold at list price, down from 20.36 percent last month. Meanwhile, 11.16 percent of properties have sold above list price, up from 9.55 percent last month but still below the 12.08 percent recorded in February 2025.
The average sold to list price ratio currently stands at 96.94 percent. That means, on average, sellers are accepting just over three percent below asking price. This confirms that concessions remain common across most price ranges and that buyers continue to negotiate successfully. While we are seeing occasional competitive situations, the data clearly shows that the majority of transactions close below original list price.
Regional and ZIP Code Variations
Market performance across Central Texas continues to vary by city and ZIP code. Among the 30 cities tracked, 20 have recorded month over month price increases, while 10 have declined. Year over year, 14 cities show price increases and 16 show declines. Short term stabilization is visible in several markets, but the broader year over year picture remains mixed.
When measured from peak pricing over the past 12 months, none of the 30 cities are currently above their prior peak values, and all 30 remain below peak. This confirms that while some short term gains are occurring, the broader reset from peak valuations is still intact.
At the ZIP code level, dispersion is even more pronounced. Of the 75 ZIP codes tracked, 40 have recorded month over month price increases and 35 have declined. Year over year, 34 ZIP codes show price increases and 41 show declines. However, when measured against peak levels from the past 12 months, only one ZIP code has surpassed its prior high, while 74 remain below peak pricing. This highlights how localized the Austin real estate market has become. Some neighborhoods are stabilizing, but most are still operating below recent highs.
Prices Relative to Peak Levels
Prices across the Austin-Area MLS remain materially below prior market highs. The average list price peaked in March 2023 at $708,929 and is currently $660,811, down approximately 6.8 percent from peak. The median list price peaked in May 2022 at $539,900 and is now $440,000, down roughly 18.5 percent.
The average sold price peaked in May 2022 at $664,515 and is currently $546,022, a decline of about 17.8 percent. The median sold price peaked at $538,000 and is now $411,679, down approximately 23.5 percent. On a price per square foot basis, the average has declined from $324 to $244, down about 24.7 percent, while the median has fallen from $280 to $204, down roughly 27.1 percent. These figures confirm that while the market has stabilized compared to its most volatile period, it remains significantly below its 2022 highs.
Within the City of Austin, peak to current declines are also meaningful. The average list price peaked at $959,497 and is currently $927,504, down about 3.3 percent. The median list price peaked at $658,589 and is now $599,000, down approximately 9.0 percent. The average sold price peaked at $847,583 and is currently $706,890, down about 16.6 percent. The median sold price peaked at $680,000 and is now $545,000, a decline of roughly 19.9 percent. Price per square foot metrics inside the city remain down more than 26 percent to 28 percent from peak levels, reinforcing that valuation adjustments in the urban core remain substantial.
Market Outlook
As February 2026 progresses, the Austin real estate market continues to operate in a slower and more balanced environment. Inventory across the Austin-Area MLS is higher than last year, Months of Inventory has expanded, and most homes are selling below list price. Average and median pricing measures are modestly lower year over year, with more pronounced adjustments inside the City of Austin at higher price points.
For buyers, this environment offers negotiating leverage and broader selection. For sellers, success depends on pricing in line with current absorption levels rather than anchoring to past peak values. The data shows a market that is stabilizing but not accelerating. It is not collapsing, yet it is not overheated. In today’s Austin housing market, clarity comes from understanding the numbers, and those numbers point to balance, discipline, and continued normalization.